Lesson Overview: Getting Set Up for the Course
In this lesson, we’ll go through the requirements to get set up for the course. By the end, you’ll have the setup, tools, and resources required to complete the embedding steps in this course.
Objectives
The objectives of this lesson include the following:
- Ensure the pre-conditions for adding custom chart are met
- Review BYOC Documentation resources
- Familiarize with Developer’s Playground
- Download the examples for custom chart code
Pre-conditions
To follow along with this course, you’ll need a ThoughtSpot user account with developer privileges and access to ThoughtSpot Custom chart features. If you don’t already have an account, you can create a trial account that’s valid for 14 days and comes with ThoughtSpot Embedded enabled.
Requirements
- A modern web browser
We’ll use Google Chrome in the examples, but you can also use other browsers like Mozilla Firefox or Safari.
Note:
In this tutorial, we will use a cookie-based session, so you need to enable third-party cookies / cross-site tracking, which some browsers disable by default.
-
A text editor for editing code You can use any text editor, but an IDE that supports HTML, CSS, and JavaScript will work better. The examples in this course use Visual Studio Code, a popular IDE for web development.
-
A server to run the code We’ll be running a very basic web application, so you don’t need a complex web server. This course uses ngrok for tunnelling purposes to quckily have a https based url and have a faster development cycle. For Deploying the chart we will be using vercel after the final development.
Review ThoughtSpot BYOC documentation
ThoughtSpot provides detailed documentation about customization and the SDK. There are two places you can get the documentation:
-
On this site: [add site name when deployed]
-
Via the Guide link in the Develop page in ThoughtSpot UI
The following figure shows the links to ts-chart-SDK Guide[_to_be_added].
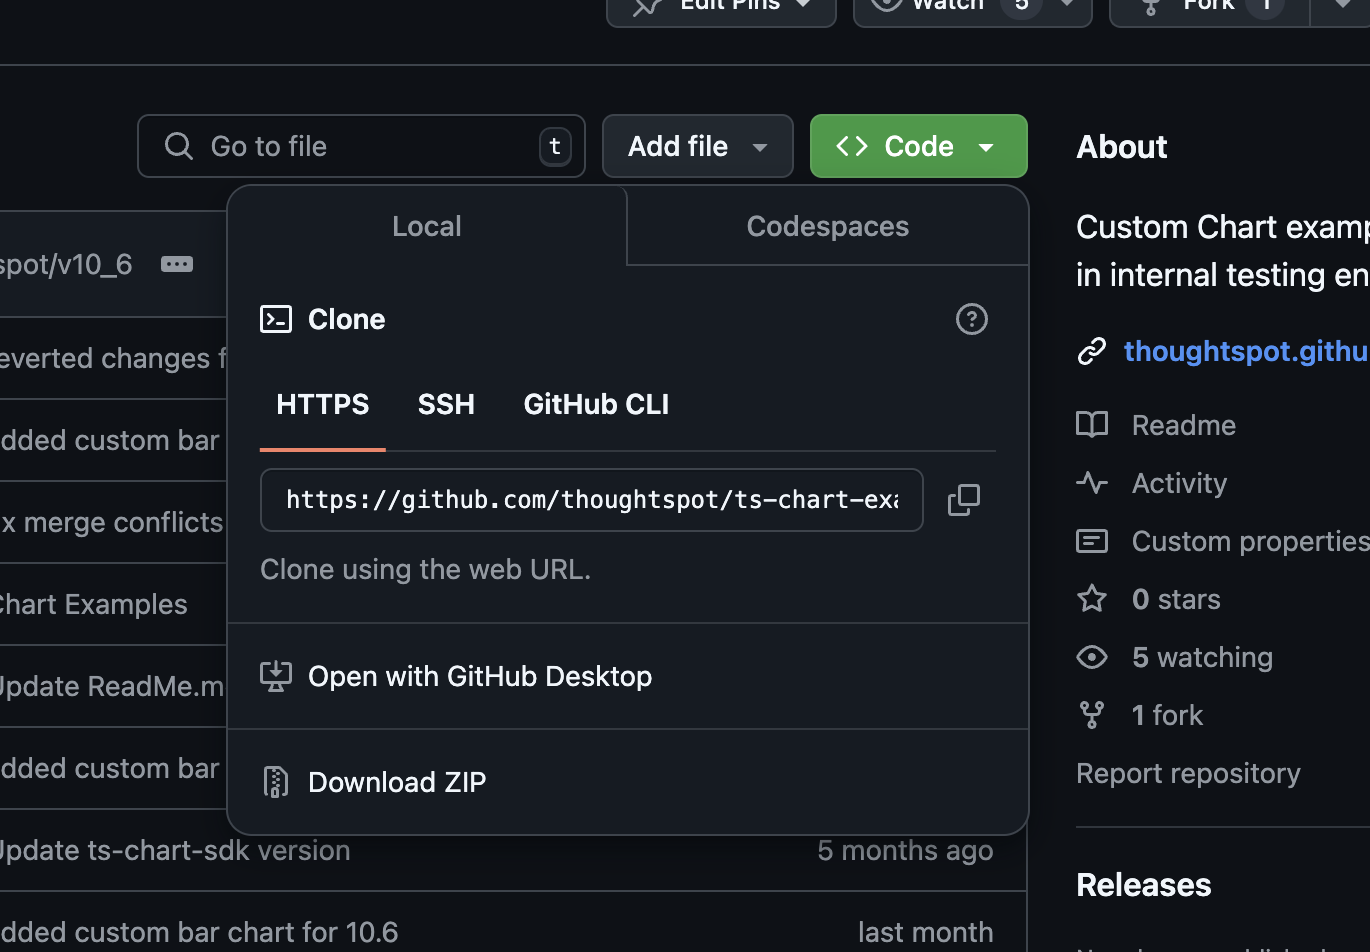
Download the examples for custom chart code
Before beginning, you should download the examples code from GitHub. As of now we support many chart integration examples such as bar chart, gauge chart, map chart, gantt chart. The recommended approach is to use the git clone command to make a local copy, perhaps after forking the code base. If you don’t want to take this route (or don’t know what those commands are), you can download the code using the Download Zip option as shown in the following figure:
git clone https://github.com/thoughtspot/ts-chart-examples.git
NOTE: In this tutorial we will be creating a custom-bar-chart with very minimal feature u may find different code for example for this chart because new features are added as they are updated to make example more reboust u can go through the code after this tutorial and take help of Guide to go any specific feature.